

Visualizers
Open the full player and swipe left on the artwork. Three visualizers are waiting behind it, drawn live from whatever is playing.
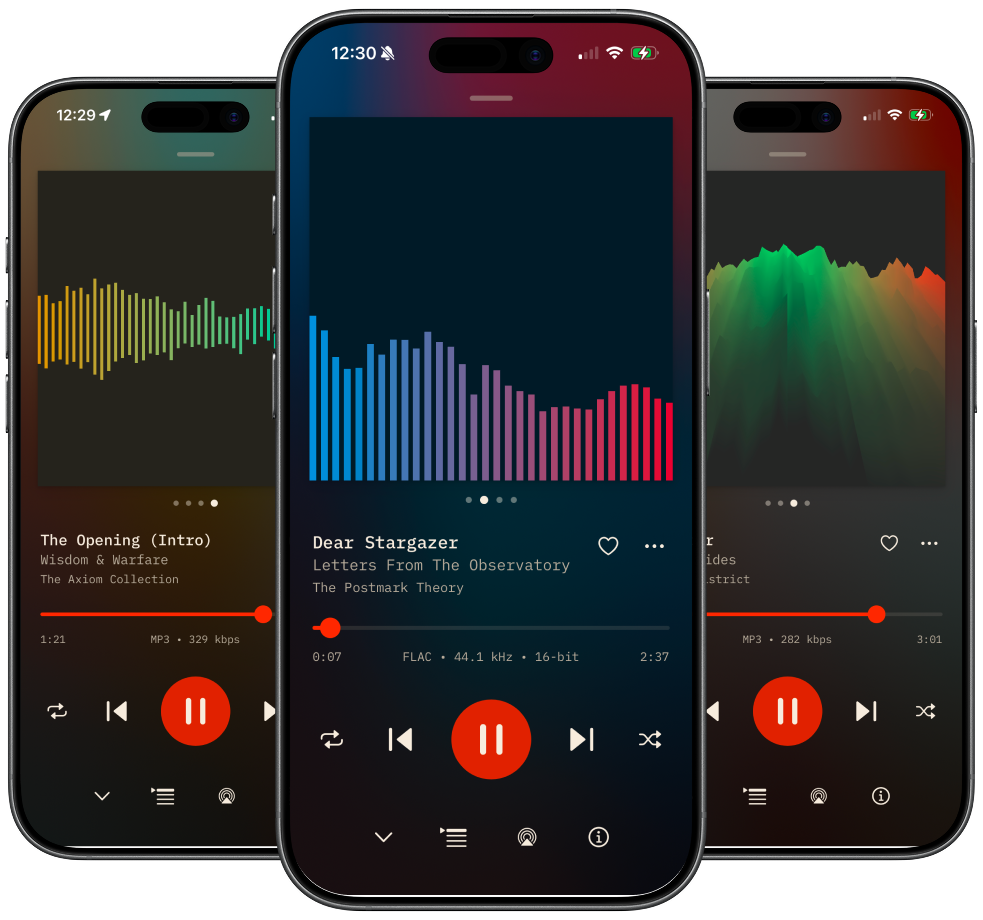
Swipe between four views
Section titled “Swipe between four views”The square at the top of the full player holds four pages. Swipe sideways to move between them.
- Album artwork, the page you land on
- Bars, a classic spectrum analyzer rising from the bottom
- Landscape, a scrolling terrain built from the spectrum over time
- Mirrored bars, the spectrum reflected around a center line
The dots under the square tell you where you are. Your position holds while the album plays, so pick a visualizer once and stay there.
Fullscreen (the hidden feature)
Section titled “Fullscreen (the hidden feature)”Every visualizer expands to fill the screen, and nothing on screen says so. That part is deliberate. A fullscreen button would have to live permanently on top of your album artwork, which is a poor trade for a control you reach for once a session. So the gesture stays quiet, which does mean somebody has to tell you about it. Consider yourself told.
To expand: double-tap the visualizer, press and hold it, or pinch outward.
To come back: tap once, or pinch inward.
Fullscreen hides the status bar and the home indicator, so you get the whole display and nothing else. All four pages stay swipeable in there, including the artwork, which becomes a decent way to look at a cover properly.
Prop the phone against something on a shelf and it earns its keep as an object in the room.
What the bars actually show
Section titled “What the bars actually show”Each bar owns a slice of the frequency spectrum, running from 20 Hz on the left to 20 kHz on the right. Bar height is the energy in that slice right now.
The slices are spaced logarithmically and snapped to musical intervals, which is why the movement tracks what you hear rather than crowding everything into the treble. Human hearing works in octaves, and a linear spectrum spends most of its width on frequencies you barely notice.
Version 1.3.0 rebuilt this pipeline. Every bar now averages the frequency bins its band actually covers, so the display is an honest reading of the spectrum. Earlier versions smeared energy across bars and showed the wrong content in the low end.
It reacts to the equalizer
Section titled “It reacts to the equalizer”Open the equalizer and pull the bass bands down while a visualizer is running. The left side of the display drops with them.
The visualizer reads the audio after processing, so what you see is what is going to your ears. That makes it a useful way to check whether an EQ preset is doing what you think it is doing. See The equalizer for the bands and presets.
The mini indicator
Section titled “The mini indicator”The visualizers turn up in one more place, well away from the player. Play a track from your queue or a playlist and the row for the current track carries a small animated bar pattern where a static now-playing icon would normally sit.
It runs on the same audio data as the full-size versions. Small and quiet, and it tells you which row is playing without your having to read anything.
Built on Metal
Section titled “Built on Metal”The visualizers render on the GPU using Metal, Apple’s graphics framework. Audio analysis and drawing stay off the main thread, so playback and scrolling are unaffected by whatever is on screen.
Leave one running for a whole album and nothing stutters.
Related pages
Section titled “Related pages”- The equalizer - The 10-band EQ the visualizers respond to
- The Audio Quality sheet - The signal path behind what you are seeing
- The play queue - Where the mini indicator appears
- Themes - Theme colors carry through the player